


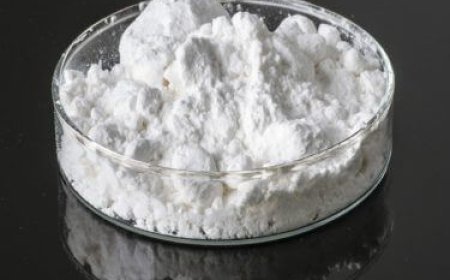



















Calcium Chloride Prices Q2 2026: Price Trends, Forecast, Chart, Prices and Index
Calcium Chloride Prices showed a mixed movement across major markets during Q2 2026.


Calcium Chloride Prices showed a mixed movement across major markets during Q2 2026. Some regions experienced price increases because of stronger buying activity, restocking, and steady industrial demand, while others saw prices move lower because supply availability improved and inventories were sufficient. India and Thailand recorded small quarterly increases, Nigeria and the USA saw stronger growth, while Australia moved lower. These different movements show that calcium chloride prices are closely connected to local demand, supply conditions, inventory levels, logistics, and procurement decisions.
Calcium chloride is a widely used industrial chemical with applications across many everyday and industrial activities. It is used in water treatment, construction, oil and gas, de-icing, food processing, mining, paper manufacturing, and chemical processing. Because it serves so many industries, its market can respond differently from one region to another. When industrial activity increases, buyers may purchase more material and prices can rise. When supply is comfortable and inventories are high, buyers may have less urgency and prices can soften.
👉 👉 👉 Please Submit Your Query for Calcium Chloride Prices, demand-supply, suppliers, market analysis: https://www.price-watch.ai/book-a-demo/
Calcium Chloride Price Trend in Q2 2026
The overall Calcium Chloride Price trend during Q2 2026 was mixed. The market did not move in one direction globally. Instead, individual regions responded to their own supply and demand conditions.
The data for the quarter shows that the largest increase occurred in the USA, where prices rose by 14% compared with the previous quarter. Nigeria also recorded a strong increase of 6%. India and Thailand both increased by 1%, while Australia recorded a 4% decline.
These movements were influenced by several familiar market factors. Demand from water treatment, construction, oil drilling, de-icing, mining, and chemical industries provided different levels of support. At the same time, inventory positions, product availability, import requirements, and purchasing schedules affected how buyers responded to the market.
This is why looking only at a global average may not provide the full picture. A buyer in one country may experience rising prices while another buyer sees a decline during exactly the same period.
India Calcium Chloride Prices
India recorded a 1% increase in calcium chloride prices during Q2 2026 compared with the previous quarter average. The market remained supported by steady demand from water treatment, construction, and oil drilling activities.
Supply availability remained relatively balanced, while procurement continued at a steady pace. This created a market where buyers were active but did not face a major supply shortage.
The Calcium Chloride Price trend in India was firm during April, supported by consistent industrial consumption and controlled supply conditions.
June brought a more noticeable monthly movement. Calcium chloride prices in India increased by 8.5% compared with the previous month average. The rise was linked to increased purchases, stable demand, and improved market confidence.
The difference between the quarterly and monthly figures is important. A 1% quarterly increase suggests relatively moderate growth across the period, while the stronger June movement shows that market conditions became more active toward the end of the quarter.
Thailand Calcium Chloride Market
Thailand also recorded a 1% increase during Q2 2026 compared with the previous quarter average.
Demand from water treatment, paper manufacturing, and chemical processing industries continued to provide support. Supply availability remained balanced, and import activity continued at a regular pace.
During April, the Calcium Chloride Price trend in Thailand was relatively stable. Purchasing interest remained moderate, and there were no major signs of supply pressure.
The market became more active in June. Calcium chloride prices increased by 8% compared with the previous month average. Stronger procurement activity and steady industrial consumption contributed to the increase.
The Thai market therefore moved from relatively calm conditions earlier in the quarter to stronger price activity toward June.
Nigeria Calcium Chloride Prices
Nigeria recorded one of the stronger quarterly increases among the markets covered. Calcium chloride prices increased by 6% during Q2 2026 compared with the previous quarter average.
The market received support from demand in oil drilling, construction, and water treatment. Import requirements also remained important because local availability was limited.
The Calcium Chloride Price trend in Nigeria moved upward during April, supported by continued industrial use and increased buying interest.
In June, prices increased by 3% compared with May. Although supply conditions improved slightly, demand from important industries remained steady.
The Nigerian market shows how import dependence can influence pricing. When local availability is limited, buyers may rely more heavily on imported material, making procurement activity and supply conditions important parts of the price picture.
USA Calcium Chloride Prices
The USA recorded the strongest quarterly increase in the provided Q2 2026 data. Calcium chloride prices increased by 14% compared with the previous quarter average.
The market was supported by demand from de-icing, water treatment, and chemical manufacturing. Buyers also increased procurement activity as they focused on maintaining inventory levels.
The Calcium Chloride Price trend in the USA showed strong upward movement during April. Firm consumption and limited flexibility in supply contributed to the stronger market conditions.
In June, prices increased by another 3% compared with the previous month average. Industrial demand remained steady, helping keep the market positive.
The quarterly increase of 14% indicates that the US market experienced considerably stronger price pressure than several other regions during Q2.
Australia Calcium Chloride Prices
Australia was different from the other markets in the Q2 2026 data. Calcium chloride prices declined by 4% compared with the previous quarter average.
The decline was mainly connected with improved product availability and balanced supply conditions. Demand from water treatment, mining, and construction remained stable, but buyers did not face the same supply pressure seen in some other markets.
In April, the Calcium Chloride Price trend in Australia was softer because buying pressure was lower and inventories were sufficient.
However, the market changed toward the end of the quarter. In June, calcium chloride prices increased by 5% compared with the previous month average as procurement activity improved and demand gradually recovered.
This shows that a quarterly decline does not necessarily mean that the market will continue moving downward every month. Market conditions can change quickly as buyers return to the market or inventories are adjusted.
Calcium Chloride Price Chart: Q2 2026 Regional Comparison
A Calcium Chloride Price Chart for Q2 2026 would show noticeable differences between the five markets.
The quarterly price changes were:
-
India: +1%
-
Thailand: +1%
-
Nigeria: +6%
-
USA: +14%
-
Australia: -4%
The chart would make one point very clear: the global calcium chloride market was not moving uniformly.
The USA recorded the largest increase, while Australia recorded the only decline among these markets. Nigeria also experienced a meaningful increase, while India and Thailand showed more moderate quarterly growth.
Monthly movements were also different. India increased by 8.5% in June, Thailand by 8%, Nigeria by 3%, and the USA by 3%. Australia increased by 5% in June after experiencing softer conditions earlier in the quarter.
For buyers, these differences matter because regional pricing can be affected by factors that are not visible in a global market average.
Calcium Chloride Price Index and Market Conditions
The Calcium Chloride Price Index is useful for understanding broader changes in the market. During Q2 2026, the index direction was influenced by production costs, product availability, industrial consumption, inventory levels, and procurement activity.
A price index provides a broader view, but individual market conditions remain important. For example, the USA experienced a substantial quarterly increase while Australia recorded a decline. Both markets were part of the same global calcium chloride market, but their local conditions were different.
The index can therefore be used together with regional pricing information to understand whether changes are broad-based or concentrated in specific markets.
What Influenced Calcium Chloride Prices in Q2 2026?
Several factors shaped the market during the quarter.
Industrial demand was one of the main influences. Water treatment, construction, oil and gas, chemical manufacturing, mining, paper manufacturing, and de-icing all contributed to regional consumption.
Supply availability also played an important role. Where material was readily available, buyers had less urgency. Where supply flexibility was limited, procurement activity could place more pressure on prices.
Inventory levels were another important factor. Buyers with comfortable inventories could delay purchases, while businesses needing to rebuild stocks could become more active in the market.
Procurement activity also changed during the quarter. Several markets saw stronger buying toward June, which contributed to monthly price increases.
Trade and logistics remained relevant as well. Imported calcium chloride prices depend not only on the product itself but also on the movement of material from the exporting market to the destination.
Calcium Chloride Price Forecast
Looking ahead, the Q2 2026 data suggests that regional differences will remain important when considering the Calcium Chloride Price forecast.
The forecast should not be treated as a guaranteed prediction because future prices can change when supply, demand, inventories, logistics, or industrial activity changes. However, the Q2 market provides useful signals.
Markets with stronger industrial consumption may continue to require regular procurement, while regions with comfortable supply may experience more stable pricing. Restocking activity could also influence short-term demand.
For buyers, it may be useful to monitor monthly price movements rather than relying only on quarterly averages. The June figures demonstrate why this matters. India and Thailand, for example, recorded relatively small quarterly increases but much stronger monthly increases in June.
Why Calcium Chloride Prices Matter to Businesses
Calcium chloride is used across several industries, so price changes can affect procurement budgets and operating costs.
For a water treatment business, changes in calcium chloride prices can affect chemical purchasing expenses. In construction, mining, oil drilling, and industrial processing, the same price movement can influence material costs and purchasing plans.
This is why businesses often monitor prices, supply availability, inventory levels, and market demand together. Looking at only one factor may not provide a complete understanding of the market.
Conclusion
The Q2 2026 calcium chloride market showed a clear mix of regional price movements. India and Thailand recorded modest quarterly increases of 1%, Nigeria increased by 6%, and the USA recorded the strongest rise at 14%. Australia moved in the opposite direction, declining by 4% during the quarter.
At the same time, monthly movements showed that market conditions were changing toward June. India and Thailand recorded strong monthly increases of 8.5% and 8%, respectively. Nigeria and the USA increased by 3%, while Australia recovered with a 5% monthly increase after a softer period.
Overall, the Calcium Chloride Price trend during Q2 2026 was shaped by industrial demand, supply availability, inventory adjustments, procurement activity, and regional trade conditions. The Calcium Chloride Price Chart provides a useful way to compare regional movements, while the Calcium Chloride Price Index helps provide a broader view of market direction.
For businesses following the market, the key lesson from Q2 2026 is that calcium chloride prices can change differently from one region to another. Regularly tracking demand, supply, inventory, imports, and monthly price movements can provide a clearer understanding of where the market may be heading.
About Price Watch™
Price Watch™ AI is an India-based, independent price reporting agency (PRA) that provides real-time price forecasts and data-driven insights into global raw material markets. It specializes in tracking prices, analyzing market trends, and delivering timely updates on plant shutdowns, supply disruptions, capacity expansions, and demand–supply dynamics. Price Watch™ AI reporting goes beyond prices to include grade-level insights, applications, and country-level demand intelligence you can trust. Powered by AI forecasting and over a decade of historical data, the Price Watch™ AI platform empowers manufacturers, traders, and procurement professionals to make faster, smarter decisions and turn market volatility into actionable opportunity.
Futura Tech Park,
C Block, 8th floor 334,
Old Mahabalipuram Road,
Sholinganallur, Chennai, Tamil Nadu, Pincode - 600119.
LinkedIn: https://www.linkedin.com/company/price-watch-ai/
Facebook: https://www.facebook.com/people/Price-Watch/61568490385598/
Twitter: https://x.com/pricewatchai
Website: https://www.price-watch.ai
What's Your Reaction?
 Like
0
Like
0
 Dislike
0
Dislike
0
 Love
0
Love
0
 Funny
0
Funny
0
 Angry
0
Angry
0
 Sad
0
Sad
0
 Wow
0
Wow
0