

























Sodium Silicate Market 2026: Price Trends, Forecast, Chart, Prices And Index
The sodium silicate market remained firm and moved upward during Q2 2026 as higher soda ash costs

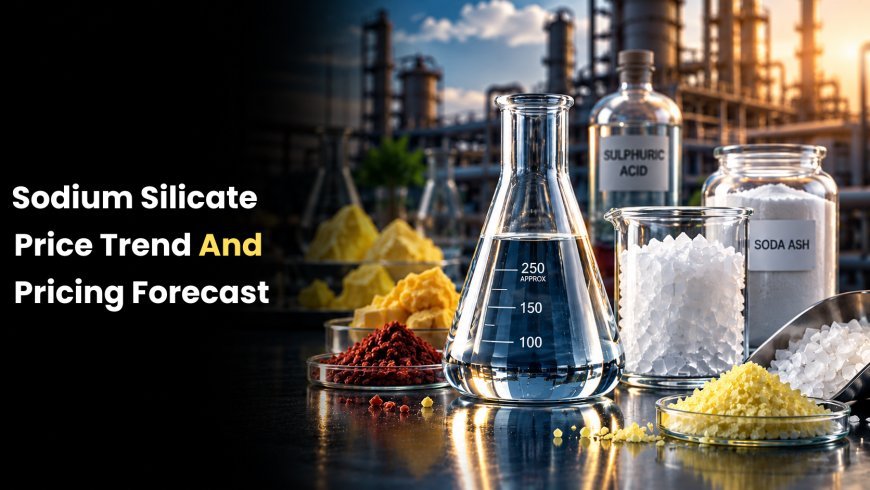
The sodium silicate market remained firm and moved upward during Q2 2026 as higher soda ash costs, supply disruptions, rising freight expenses, and steady industrial demand put pressure on prices. The market was also influenced by disruptions linked to the USA–Iran conflict, which affected international trade flows and increased logistics uncertainty. As a result, the sodium silicate price moved higher across several important producing and importing regions during the quarter.
Sodium silicate is a widely used industrial chemical. It has applications in detergents, construction, paper, water treatment, foundry operations, adhesives, and other industrial processes. Because it is used across many different industries, its market can be influenced by several factors at the same time. Raw material costs matter, but transportation, supply availability, inventories, and downstream demand can also make a noticeable difference.
Q2 2026 was a good example of this. The market did not experience just one reason for higher prices. Instead, several cost and supply factors came together and kept the market on a firm footing.
👉 👉 👉 Please Submit Your Query for sodium silicate market, demand-supply, suppliers, market analysis: https://www.price-watch.ai/book-a-demo/
Sodium Silicate Price Trend in Q2 2026
The overall sodium silicate price trend during Q2 2026 was upward.
One of the main factors was the increase in soda ash feedstock prices. Soda ash is an important raw material in sodium silicate production, so changes in its cost can have a direct effect on the economics of manufacturing sodium silicate.
At the same time, supply disruptions affected international trade. The USA–Iran conflict created additional uncertainty for shipping and logistics. For suppliers and buyers, this meant that moving products between countries became more complicated and expensive.
Another important factor was product availability. Supplies remained relatively tight in some markets, while suppliers maintained disciplined pricing. Balanced inventories also helped prevent a significant decline in prices.
Demand, meanwhile, remained healthy. Industries such as detergents, construction, paper, water treatment, foundry, and adhesives continued to purchase sodium silicate. This steady consumption provided support to the market even as supply conditions became more challenging.
Why Did Sodium Silicate Prices Increase?
There were several simple reasons behind the Q2 2026 increase.
Higher Soda Ash Costs
The cost of soda ash was one of the most important factors.
When a key feedstock becomes more expensive, manufacturers face higher production costs. Producers then have to consider those costs when making new offers to customers.
This was particularly important during Q2 2026 because the increase in feedstock costs occurred at the same time as higher transportation and logistics expenses.
Supply Disruptions
Supply availability was another major factor.
International trade was affected by geopolitical uncertainty and shipping-related challenges. These disruptions did not necessarily stop the market completely, but they made supply less predictable.
When buyers are uncertain about delivery schedules or future availability, they may try to secure material earlier. This can provide additional support to prices.
Higher Freight Costs
Freight costs became an important part of the market story during the quarter.
For an imported chemical, the final cost is not only the manufacturer's selling price. Buyers also have to consider shipping, handling, insurance, port expenses, and other logistics costs.
When freight rates rise, import prices can increase even if the underlying chemical price changes only moderately.
Steady Downstream Demand
Demand remained another important source of support.
Sodium silicate is used in a wide range of industries. Detergents, construction materials, paper production, water treatment, foundries, and adhesive applications all contributed to regular purchasing activity during Q2.
This steady demand helped maintain a healthy market balance.
China Sodium Silicate Market
China remained an important reference point for the global market.
During Q2 2026, sodium silicate export prices in China remained on a firm upward path. The market was supported by higher soda ash costs, supply disruptions, and increased logistics pressure.
The product considered here was industrial-grade sodium silicate powder with a 120-mesh size, quoted on an FOB Shanghai basis.
Supplier pricing remained disciplined, while inventories stayed relatively balanced. Export inquiries also remained active.
In June 2026, the Chinese sodium silicate price increased by 7.5% compared with May.
The June increase was connected with stronger feedstock costs, limited export availability, and firm supplier offers. These factors kept the market positive toward the end of the quarter.
The Chinese market was particularly important because several Asian importing countries followed the movement in China FOB prices.
India Sodium Silicate Market
India also experienced a firm market during Q2 2026.
The industrial-grade sodium silicate considered for India was alkaline glass grade with an alkalinity range of 2.1–2.3, quoted on an FOB JNPT basis.
Higher soda ash prices increased production costs, while supply chain disruptions added pressure to the market.
Domestic supply was relatively tight, and suppliers maintained disciplined pricing. Inventories remained balanced, while demand from important downstream industries continued.
Detergents, construction, paper, water treatment, foundry, and adhesive industries continued to support purchasing activity.
In June 2026, the Indian sodium silicate price increased by 4% compared with May.
The increase was linked with higher feedstock costs, constrained availability, and firm supplier offers.
Indonesia Sodium Silicate Price
Indonesia followed the stronger Chinese export market during Q2 2026.
The country's import price was closely connected with China FOB movements because China was an important source of supply. As Chinese offers became firmer, Indonesian import prices also came under upward pressure.
Higher soda ash prices increased production costs, while freight expenses added to the cost of importing the product.
Demand from detergents, construction, paper, water treatment, foundry, and adhesive industries remained supportive.
In June 2026, the Indonesian sodium silicate price increased by 7%.
The increase reflected firmer China FOB prices, higher feedstock costs, and tighter import availability.
Philippines Sodium Silicate Market
The Philippines also experienced a firm upward movement during the quarter.
Import prices followed the stronger China FOB trend. Higher feedstock expenses increased the cost base for manufacturers, while freight costs increased the expense of bringing material into the country.
Supplier pricing remained disciplined, and import availability was balanced but not overly loose.
Demand from major downstream industries continued to provide support.
In June 2026, sodium silicate prices in the Philippines increased by around 7.5%.
The increase was connected with stronger China export offers, higher feedstock expenses, and tighter import availability.
Vietnam Sodium Silicate Price
Vietnam's market also followed the general direction of China during Q2 2026.
As China FOB prices moved higher, Vietnamese import offers became firmer. Rising soda ash costs increased the upstream production cost, while freight expenses added further pressure.
Downstream demand remained steady across detergents, construction, paper, water treatment, foundry, and adhesive applications.
In June 2026, Vietnamese sodium silicate prices increased by around 7%.
The increase reflected stronger China FOB offers, higher feedstock costs, and relatively tighter import availability.
Argentina Sodium Silicate Market
Argentina also recorded a firm sodium silicate market during Q2 2026.
Import prices followed the strengthening China FOB trend. Higher feedstock prices increased production costs, while elevated freight expenses increased the cost of bringing material into the Argentine market.
Suppliers maintained disciplined pricing, and balanced inventories helped support stable procurement activity.
Demand from detergents, construction, paper, water treatment, foundry, and adhesive industries remained supportive.
In June 2026, sodium silicate prices in Argentina increased by approximately 6.5%.
The monthly increase was linked with firmer Chinese export prices, higher feedstock expenses, and tighter import availability.
Liquid Sodium Silicate Market
The liquid sodium silicate market is an important part of the wider sodium silicate industry.
Liquid sodium silicate is used in several industrial applications, including detergents, adhesives, construction-related processes, water treatment, and other manufacturing activities.
Although the Q2 2026 source data provided here focuses on specific industrial-grade sodium silicate products, the broader market factors are useful when understanding liquid sodium silicate as well.
Raw material costs, energy expenses, transportation, production availability, and downstream demand can all influence the cost of liquid sodium silicate.
One important difference is transportation. Liquid products can have different handling and logistics requirements compared with powder or solid forms. Therefore, buyers need to consider not only the chemical price but also storage, transportation, packaging, and handling costs.
Sodium Silicate Price Chart and Index
The Q2 2026 sodium silicate price chart showed a broadly upward market direction.
China recorded a 7.5% increase in June, while Indonesia and Vietnam increased by around 7%. The Philippines recorded an increase of approximately 7.5%, Argentina around 6.5%, and India 4%.
These monthly movements show that the direction was similar across markets, although the size of the increase differed.
The sodium silicate price index also reflected firm market conditions. Higher feedstock costs, constrained supply, freight expenses, and healthy downstream demand all contributed to the stronger market.
A price index is particularly useful because it helps show the broader direction of the market rather than focusing on one individual transaction.
What Downstream Industries Mean for the Market
One reason the sodium silicate market remained strong was the variety of industries using the product.
Detergents
Sodium silicate has long been used in detergent-related applications. Continued detergent production creates regular demand for the chemical.
Construction
Construction-related applications also provide an important source of consumption. When construction activity remains healthy, demand for industrial chemicals used in construction processes can remain stable.
Paper
The paper industry is another important user. Changes in paper production can therefore influence purchasing requirements.
Water Treatment
Sodium silicate is also used in water treatment applications. This provides another source of industrial demand that can help support the market.
Foundry
Foundry operations use sodium silicate in specific processes, creating additional demand from the metal and casting industries.
Adhesives
Sodium silicate also has applications in adhesive-related processes. Demand from this segment adds to the diversity of the overall market.
Because demand comes from several industries, the market is not dependent on a single sector.
Sodium Silicate Price Forecast
Looking ahead, several factors will determine the future direction of the market.
Feedstock costs will remain important. If soda ash prices remain high, manufacturers may continue to face higher production expenses.
Supply availability will also matter. If logistics improve and product becomes more readily available, some of the supply pressure could ease. On the other hand, additional disruptions could keep the market firm.
Freight costs are another important factor for import-dependent countries. Changes in shipping costs can quickly affect delivered prices.
Downstream demand will also need to be monitored. Strong purchasing from detergents, construction, paper, water treatment, foundry, and adhesive industries could continue to support the market.
Therefore, the future sodium silicate price trend will depend on the balance between production costs, supply, logistics, and demand.
What Buyers Should Watch
For businesses purchasing sodium silicate, a few indicators can provide a useful picture of where the market may be heading.
-
Soda ash prices: Higher feedstock costs can increase production expenses.
-
China FOB prices: These are particularly important for Asian importing markets.
-
Freight rates: Higher shipping costs can increase delivered prices.
-
Product availability: Tight supply can support stronger offers.
-
Inventory levels: Balanced or low inventories can influence purchasing behavior.
-
Downstream demand: Construction, detergents, paper, water treatment, foundry, and adhesive demand can affect consumption.
-
Geopolitical conditions: International tensions can influence shipping routes and logistics costs.
Looking at all these factors together provides a better understanding of the market than focusing only on the headline price.
Conclusion
The Q2 2026 sodium silicate market remained firm and generally moved upward across the regions covered. Higher soda ash feedstock costs, supply disruptions, increased freight expenses, disciplined supplier pricing, and steady downstream demand created a supportive market environment.
China remained an important price reference, particularly for Asian importing countries. Its June price increased by 7.5%, while India recorded a 4% increase. Indonesia and Vietnam rose by around 7%, the Philippines by around 7.5%, and Argentina by around 6.5%.
The sodium silicate price trend therefore reflected a combination of higher production costs and supply-side pressure rather than one isolated market factor. The sodium silicate price chart and index both pointed toward firm conditions during the quarter.
For the months ahead, buyers and industry participants will need to watch soda ash costs, freight rates, product availability, inventories, downstream demand, and international logistics.
The Q2 2026 market shows a simple but important point: when raw material costs rise at the same time as supply becomes less flexible and transportation becomes more expensive, chemical prices can remain firm even when overall demand is simply stable rather than exceptionally strong.
About Price Watch™
Price Watch™ AI is an India-based, independent price reporting agency (PRA) that provides real-time price forecasts and data-driven insights into global raw material markets. It specializes in tracking prices, analyzing market trends, and delivering timely updates on plant shutdowns, supply disruptions, capacity expansions, and demand–supply dynamics. Price Watch™ AI reporting goes beyond prices to include grade-level insights, applications, and country-level demand intelligence you can trust. Powered by AI forecasting and over a decade of historical data, the Price Watch™ AI platform empowers manufacturers, traders, and procurement professionals to make faster, smarter decisions and turn market volatility into actionable opportunity.
Futura Tech Park,
C Block, 8th floor 334,
Old Mahabalipuram Road,
Sholinganallur, Chennai, Tamil Nadu, Pincode - 600119.
LinkedIn: https://www.linkedin.com/company/price-watch-ai/
Facebook: https://www.facebook.com/people/Price-Watch/61568490385598/
Twitter: https://x.com/pricewatchai
Website: https://www.price-watch.ai
What's Your Reaction?
 Like
0
Like
0
 Dislike
0
Dislike
0
 Love
0
Love
0
 Funny
0
Funny
0
 Angry
0
Angry
0
 Sad
0
Sad
0
 Wow
0
Wow
0